BS EN 1998-1:2004 and the UK National Annex require a site-specific seismic hazard assessment even in regions of low seismicity, and Northampton exemplifies why. The town sits on a complex transition between the Jurassic Northampton Sand Formation and the softer Lias Group clays, with alluvial deposits thickening along the Nene Valley. This geological patchwork produces sharp contrasts in shear-wave velocity over short distances. A uniform PGA assumption from a regional hazard map simply does not capture what happens at foundation level when a distant earthquake — say from the Welsh Borders or the North Sea — sends waves through these variable materials. Our team combines downhole geophysics, MASW profiling, and borehole logging to build a ground motion model that reflects Northampton’s actual subsurface, not a generic crustal average. The MASW survey results become the backbone of the Vs30 map, which then feeds directly into the seismic site classification required by the building regulations.
A site class change from B to D within a single development parcel is common along the Nene Valley, and it can double the short-period spectral acceleration used in design.
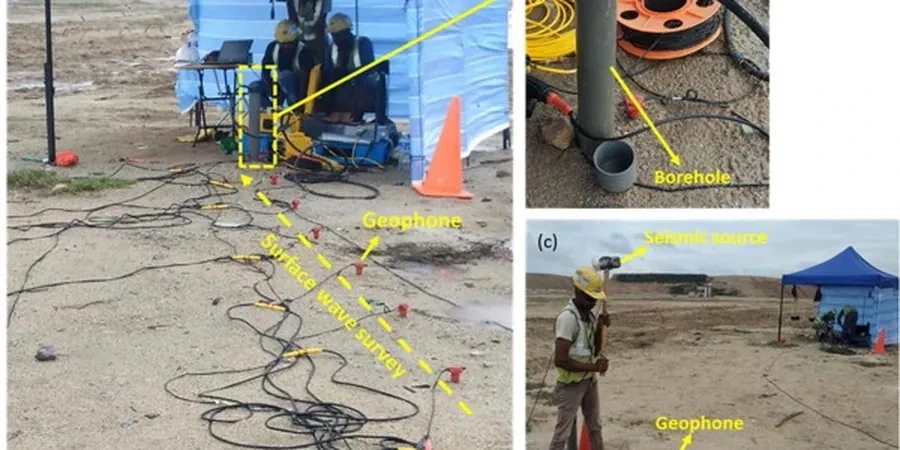
Process overview
Local context
Northampton’s population has passed 245,000 and the town is absorbing significant housing growth, particularly across the Sustainable Urban Extensions to the north and west. Much of that expansion pushes onto gently sloping Lias clay terrain that, while competent under static loads, exhibits a low-strain stiffness that amplifies long-period ground motion. What we observe in borehole arrays is a resonance peak between 0.8 and 1.2 seconds on the deeper alluvial pockets — exactly the period range where five-to-eight-storey residential frames sit. The hazard is not a direct structural collapse from shaking; it is cumulative drift, non-structural damage, and serviceability failure amplified by site effects that a non-site-specific design would overlook. Add the legacy of shallow mine workings beneath parts of the town and the picture becomes more nuanced still, because even modest cyclic strain can trigger crown hole migration in abandoned galleries. A solid microzonation study therefore does double duty: it defines the seismic demand for new build and simultaneously flags areas where Improvement or foundation stiffening should be prioritized.
Reference standards
BS EN 1998-1:2004 + UK National Annex, BS 5930:2015+A1:2020, BS EN 1997-1:2004 (Eurocode 7), IASPEI / ISSMGE guidelines for site classification
Additional services
Vs30 Mapping and Site Classification
Dense grid of MASW and refraction lines tied to borehole logs, producing a georeferenced site class map compliant with BS EN 1998-1. Each polygon carries its own design spectrum and amplification factors.
Liquefaction and Cyclic Softening Screening
CPT and SPT-based assessment following the NCEER/Youd-Idriss framework, focused on the saturated silty sands lenses found within Nene Valley alluvium. Includes post-liquefaction settlement estimates.
Borehole Geophysics and Downhole Testing
Downhole Vs and Vp profiles at 1 m intervals, plus cross-hole tomography where critical infrastructure demands it. Used to calibrate surface-wave results and anchor the 1D site response models.
Typical parameters
Top questions
What triggers a seismic microzonation requirement in Northampton when the UK is a low-seismicity region?
The trigger comes from BS EN 1998-1 and the local ground conditions rather than from a high PGA value. Where site investigation reveals soft alluvial deposits thicker than 5 m, or where Vs30 drops below 180 m/s, the code requires a site-specific hazard study. Northampton’s Nene Valley corridor routinely meets those criteria, and several planning authorities in the East Midlands now ask for a microzonation report as part of the reserved matters submission for schemes above six storeys.
How do you calibrate the geophysical measurements with actual borehole data?
We run downhole seismic tests in at least one borehole per geotechnical unit, measuring Vs at 1 m intervals. That discrete velocity log is used to constrain the inversion of the MASW dispersion curves, eliminating the non-uniqueness problem that can affect surface-wave methods alone. Where the geology changes abruptly, we add cross-hole pairs across the contact to confirm the lateral velocity gradient before drawing the zone boundary on the final map.
What is the typical cost range for a seismic microzonation study covering a 5-hectare site in Northampton?
A 5-hectare study typically falls between £3,260 and £14,560, depending on the number of geophysical lines, borehole calibration points, and the complexity of the geological transitions. A site straddling Northampton Sand and Nene alluvium requires denser coverage than a uniform plateau site, which moves the cost toward the upper end of that range.
Can microzonation results reduce foundation costs compared with a conservative code-based approach?
The reference range for this service in Northampton is £3.260 - £14.560. The final price depends on the project scope and volume.
How long does a complete microzonation study take from field work to final report?
Field work on a typical 5-to-10-hectare site takes three to five days for the geophysics and two to four days for the calibration boreholes. Data processing and 2D modelling require another two to three weeks. The final report, including the GIS-compatible zonation maps and design spectra, is usually delivered four to five weeks after the field campaign ends.