A 24-channel seismograph connected to a spread of low-frequency geophones is typically the first piece of kit unloaded on a Northampton site. The team lays out a cable array across the survey line while the trigger switch on a sledgehammer source — or a weight drop on deeper targets — sends a compressional wave into the ground. Northampton sits on the Jurassic Northampton Sand Formation overlying Lias clays, a sequence that creates a sharp velocity contrast detectable within the first 60 milliseconds of a refraction record. For deeper reflection work, the setup shifts to a higher-energy source and longer offsets, capturing returns from the Great Oolite Group limestone below the town centre. This dual approach of seismic tomography lets us map both the weathered cap and the competent bedrock in a single mobilisation, delivering a continuous velocity model rather than a handful of point measurements. When a developer near the Nene Valley needs to confirm bedrock depth before piling, the data feeds directly into a mat foundation design assessment or helps optimise the depth of a retaining wall excavation without guesswork.
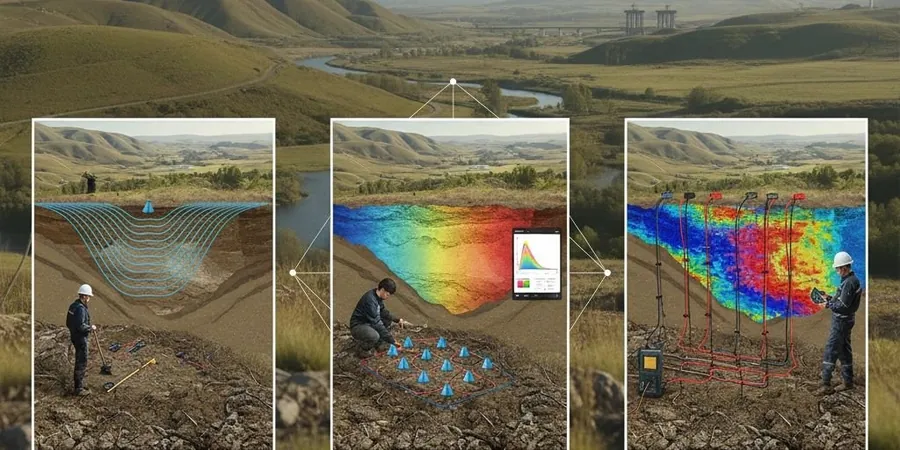
A 2D velocity cross-section reveals bedrock undulation and weathered pockets that a borehole on its own will miss.
Process overview
Local context
A warehouse extension near Brackmills Industrial Estate hit an unexpected depression in the bedrock during piling. The boreholes — spaced 30 m apart on a grid — had missed a 4-metre-deep trough filled with soft alluvial clay that the Northampton Sand had slumped into. Pile refusal depths varied by over 5 m across three adjacent piles, and the contractor had to bring in additional casing and re-design the pile cap. Seismic tomography run along the same grid before drilling would have shown the velocity collapse in that trough. Low-velocity zones below 600 m/s extending deeper than the surrounding profile are a red flag that triggers targeted investigation. On the reflection side, unmapped faults within the Lias have caused similar surprises on road schemes near the M1 corridor. The cost of a tomographic survey is a fraction of a single bored pile redesign. Ignoring the lateral variability of Northampton's geology is a gamble that site investigation budgets should not take.
Reference standards
BS 5930:2015+A1:2020, BS EN 1997-2 (Eurocode 7 — Ground investigation), ASTM D5777-18 (Seismic refraction), ASTM D7128-18 (Seismic reflection)
Additional services
Seismic Refraction Tomography
2D P-wave velocity imaging for bedrock profiling, rippability assessment, and mapping weathered zones. Typical array length 60 m to 120 m with 24 or 48 channels. Delivers a continuous velocity model calibrated to site-specific geology.
Seismic Reflection Profiling
Deeper investigation targeting limestone and mudstone interfaces below 30 m depth. Uses common-midpoint stacking and time-to-depth conversion. Suitable for fault detection and stratigraphic mapping beneath the Lias Group.
Typical parameters
Top questions
What is the difference between seismic refraction and reflection for a Northampton site?
Refraction measures the critical refracted wave that travels along a velocity boundary, so it works best when velocity increases with depth — which is common with Northampton Sand over Lias clay. It gives us a 2D model of the top 20-40 metres. Reflection records the echo from deeper interfaces using near-vertical ray paths and can image strata below 50 m, such as the limestone units beneath the Lias. The two methods complement each other: refraction for the overburden and bedrock surface, reflection for deeper structure.
Can seismic tomography detect voids or mine workings in Northampton?
Yes, within resolution limits. Northampton has historical ironstone mining, and old workings produce a velocity low in the tomogram — typically a zone where P-wave velocity drops below 500 m/s surrounded by competent rock above 1500 m/s. The method detects air-filled voids larger than roughly one-quarter of the geophone spacing. For small crown holes or partially collapsed workings, we recommend combining seismic tomography with an electrical resistivity survey for a second independent detection mechanism.
How much does a seismic tomography survey cost in Northampton?
A single-line refraction tomography survey in Northampton typically ranges from £1,920 to £4,600 depending on the array length, number of shot points, and whether reflection processing is added. A multi-line grid or a combined refraction-reflection campaign will sit at the upper end. Each quote includes field acquisition, data processing, and a report with interpreted cross-sections.
How long does a survey take and what access is needed?
Fieldwork for a single refraction line takes half a day to one day with a two-person crew. The geophone spread needs a clear, roughly straight corridor about 5 m wide. Grass, asphalt, and compacted gravel are all fine. Dense undergrowth or steep slopes slow things down. If a weight drop source is used for deeper reflection work, vehicle access to the line ends is needed. The processed report follows within five working days.